
← DEVLOG · 2026.06.30 · data
How we analyzed our game
I want to share how we analyzed our Fortnite (UEFN) game using the Analytics Device.
Our game is a 25-room roguelike. We wanted to know where players stop playing — which room, and how many.
What we measured
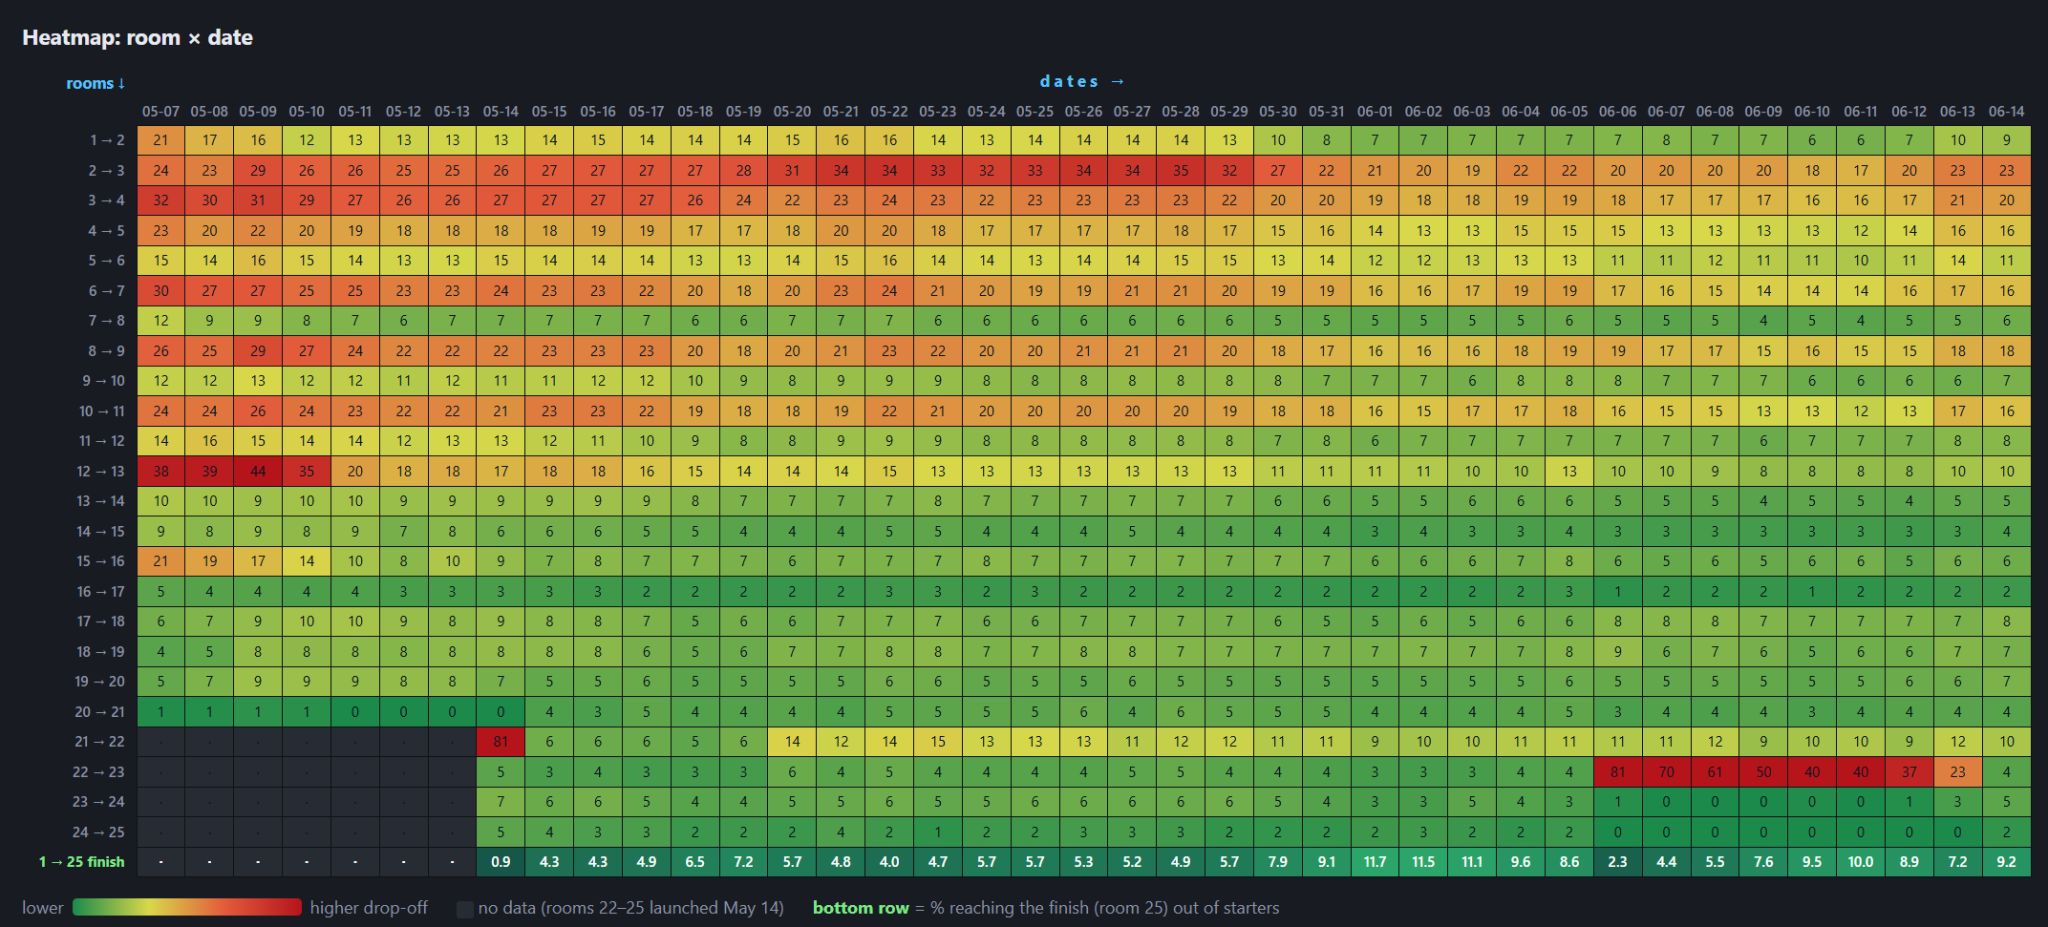
In every room we logged two events: when a player enters it, and when they are eliminated there. We exported the data as a CSV from the Creator Portal and built a heatmap: rooms on the vertical axis, days on the horizontal, color showing the drop-off between each room and the next.
What we found
- Most drop-off is early. About 60% of all lost players are lost in the first 4 rooms.
- Room 12 was too hard — it lost 38–44% of players per day. After a rebalance it dropped to ~10%.
- One spike was a bug, not difficulty. A transition jumped to 80% for a single day, then returned to normal. We found and fixed it.
- One issue wasn’t ours. On June 6 we released nothing, but drop-off in room 22 went from 4% to 81%. The cause was a UEFN platform update affecting a room we hadn’t changed. We fixed it; it’s back to ~4%.
Result: end-to-end completion went from under 1% to ~10%.
Vladislav is a great level designer — but with this data he knows exactly what needs to be balanced and where.
Takeaways
The Analytics Device is a great tool for keeping an eye on your game — it gives you key information you simply can’t get any other way. And things can break even when you haven’t shipped an update, so checking it every day is a good habit.